Operator
Monitor running workflows, track session progress, and understand where work is happening.
The Operator view is your control tower for running workflows. While the Builder is where you design workflows, the Operator view shows you the same workflow map annotated with live data — where sessions are, how long they've been at each stage, and what needs attention.
This view serves the operator persona: the person who monitors, facilitates, and understands running work across sessions. Whether you're checking on a single stuck session or reviewing the health of an entire workflow, the Operator view gives you the runtime lens you need.
Switching Between Builder and Operator
When viewing a workflow, you'll see a Builder | Operator toggle in the top bar.

- Click Builder to design and edit the workflow structure
- Click Operator to monitor running sessions and view runtime data
When you switch between views, your camera position (zoom and pan) is preserved, so you stay oriented on the same part of the workflow.
The Operations Graph
The Operator view displays the same workflow graph as the Builder, but in read-only mode with runtime annotations.
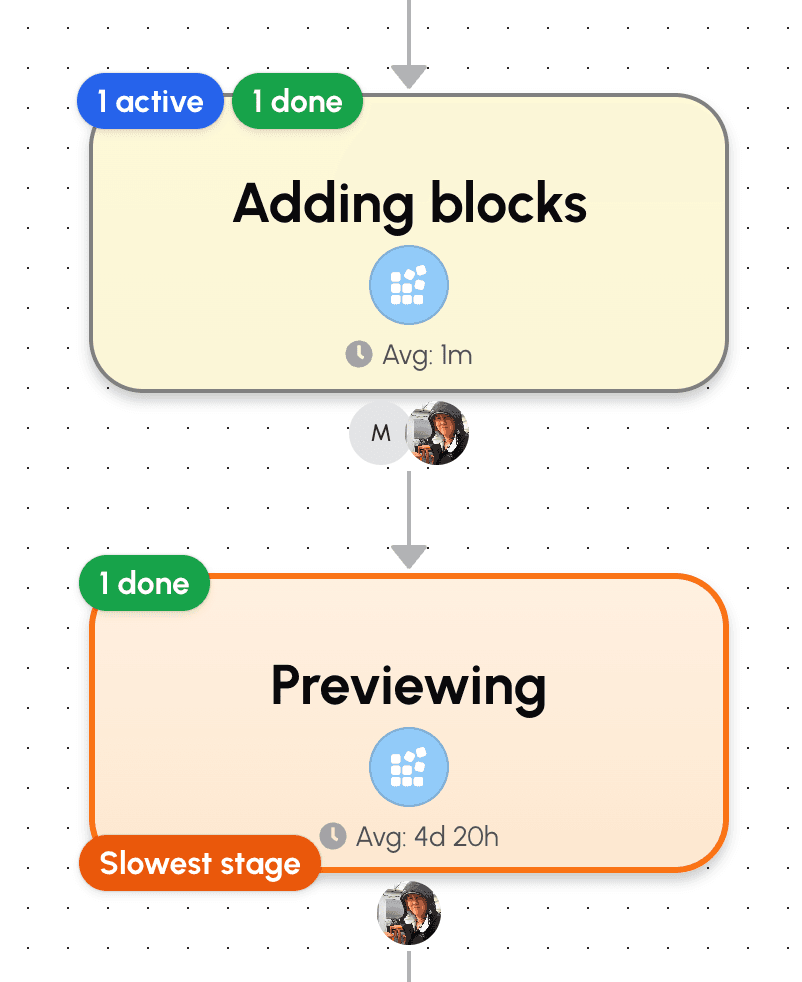
Key elements of the operations graph:
- Session count badges — Each stage node shows how many sessions are currently at that stage
- Heatmap colouring — Stages are coloured based on dwell time (how long sessions spend there), from cool to warm to hot
- Bottleneck indicators — Stages with unusual accumulation or long dwell times display visual warnings
- Conditional transition markers — Edges with rules show a flask icon indicating conditional routing
The graph helps you answer "where is work?" at a glance. Your eye is drawn to the hot spots — stages where sessions are piling up or taking too long.
Note that you cannot edit the graph in Operator view. To make changes to the workflow structure, switch back to the Builder.
The Side Panel
The side panel provides detailed views of your workflow's runtime data. A toolbar at the top lets you switch between different views.
Summary View
The Summary view is your default landing — it answers "how is this workflow doing?"
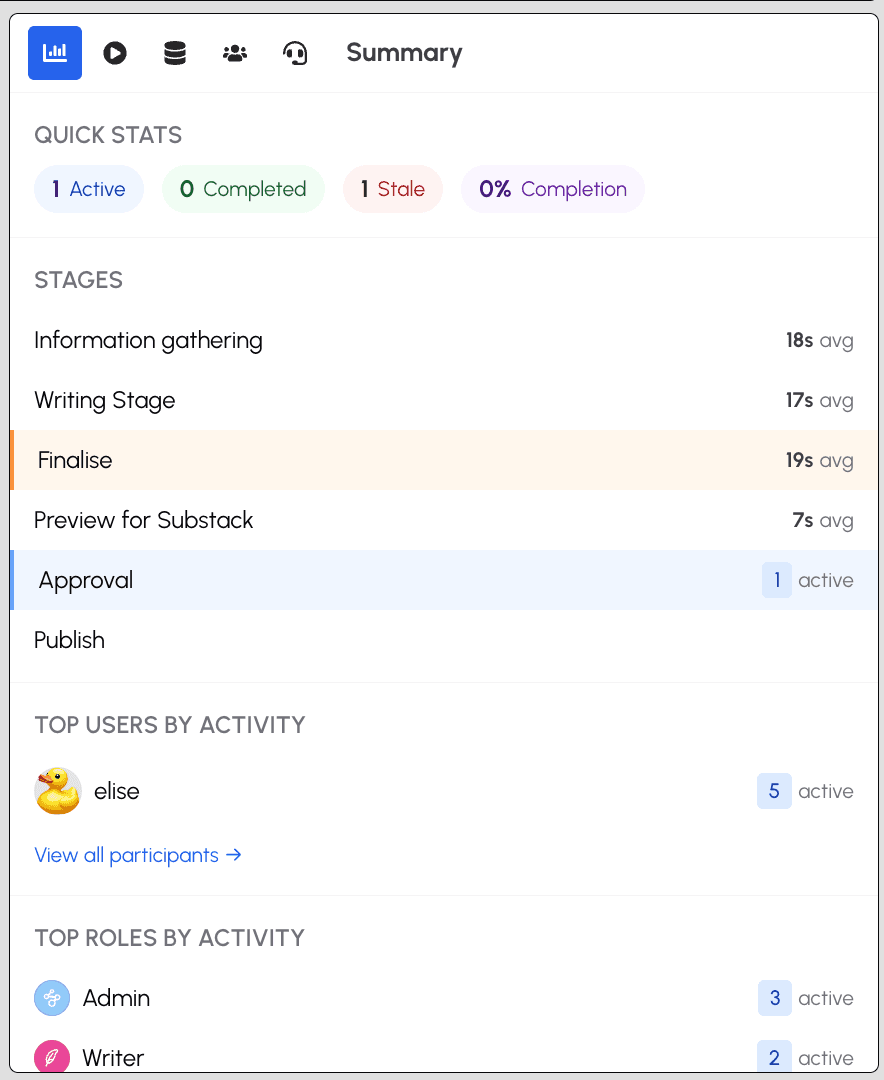
The Summary view includes:
- Workflow metrics — Active, stale, and completed session counts, plus average cycle time
- Progression funnel — A visual showing how many sessions are at each stage
- Bottleneck highlights — The slowest stages ranked by dwell time
Sessions View
The Sessions view shows all sessions for this workflow in a filterable list.
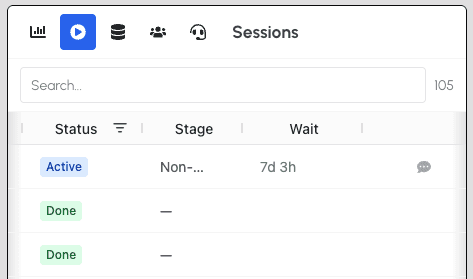
The Sessions view includes:
- Session list — Sortable by status, dwell time, or assignee
- Support indicators — Sessions with support thread activity show a badge
- Quick access — Click any session to open it
Participants View
The Participants view shows workload distribution. Use the People | Roles toggle to switch between two modes.
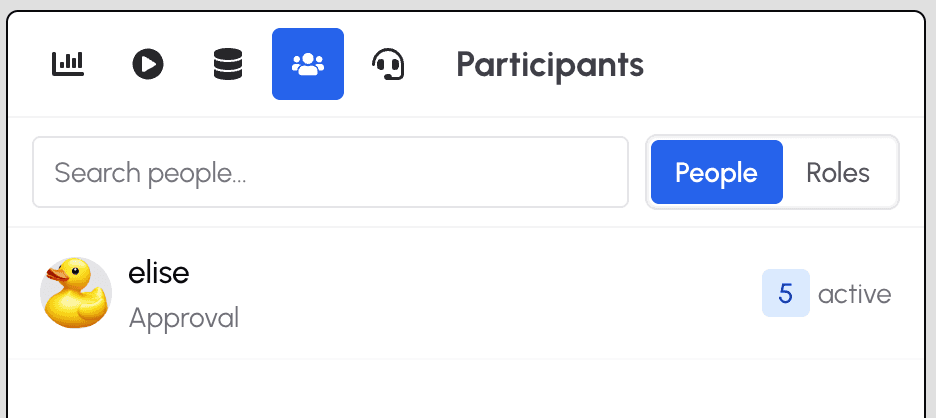
People mode shows individual participants:
- Participant list — Each person with their active session count
- Current stages — Which stages each person is working on
- Search — Filter participants by name
Roles mode shows workflow roles:
- Role list — Each role with its active session count
- Activity by role — Understand which roles have the most work
Data View
The Data view shows what data this workflow captures and what has been collected.
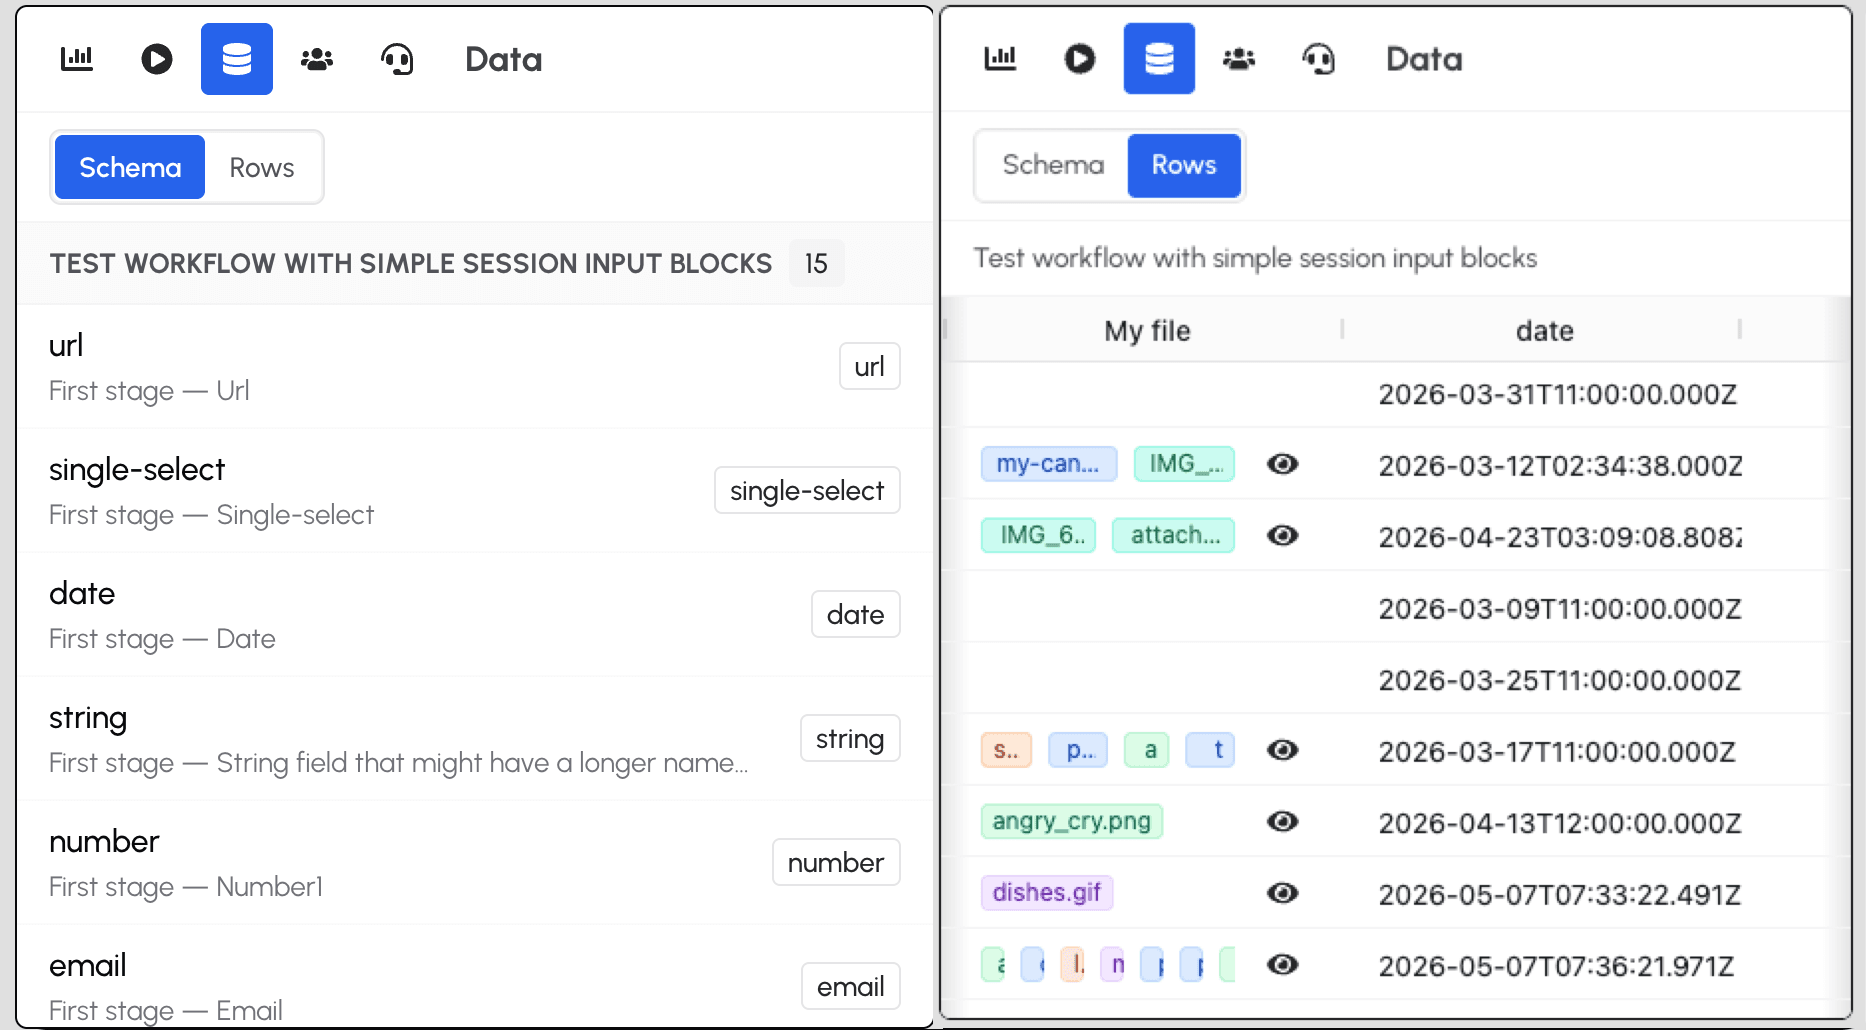
The Data view has two modes:
- Schema mode — Shows column mappings, data types, and which stage captures what
- Sheet data mode — Shows actual rows from the workflow's sessions
Support View
The Support view surfaces help requests from participants.
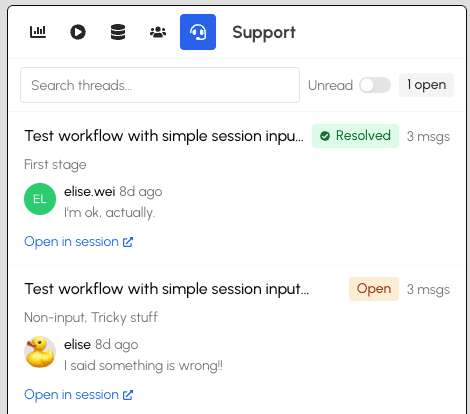
The Support view shows:
- All support threads — Both resolved and unresolved threads
- Thread status — See which threads need attention
- Quick access — Click to open the session where you can read the full thread and respond
Stage Detail Overlay
Click any stage node in the graph to see detailed information about that stage.
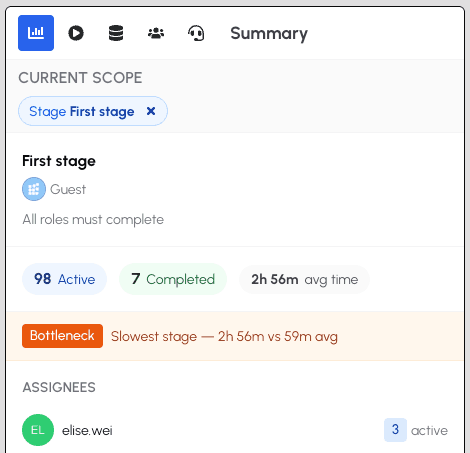
The stage detail overlay includes:
- Stage header — Stage name, completion policy, and assigned roles
- Current state — Active session count, average time at stage, and active support threads on the stage
- Assignee breakdown — Sessions grouped by assignee to identify bottlenecks
- Historical performance — Average dwell time and throughput compared to current
Click on an assignee to add them to the scope, filtering the view to show only their sessions.
Click away from the stage to return to your previous panel view.
Single Session Mode
To focus on one session's journey through the workflow, select a session from the Sessions panel or a stage detail list. The graph enters single session mode.
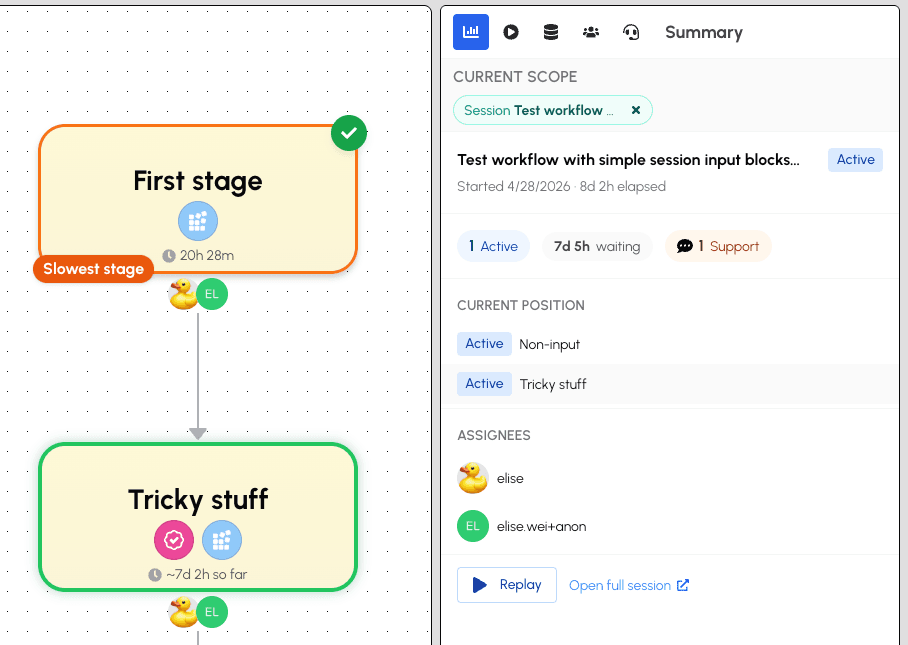
In single session mode:
- Completed stages are highlighted with checkmarks
- The current stage shows the session's position
- Untaken branches are dimmed
- Duration annotations show how long the session spent at each stage
- Assignee avatars show who worked on each stage
The side panel shows the single session report with execution timeline, participant activity, and audit log.
Session Replay
When viewing a single session, click Replay to step through the session's history event by event. Replay mode shows how the session unfolded over time.
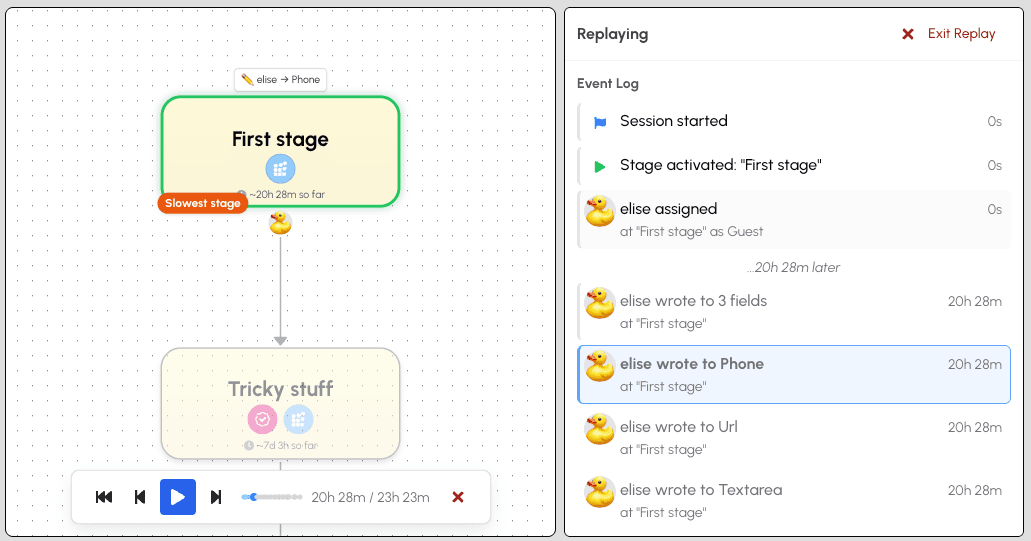
The replay controls appear at the bottom of the graph:
- Play/Pause — Automatically advance through events
- Step forward/backward — Move one event at a time
- Jump to start — Return to the beginning of the session
- Scrubber bar — Click anywhere on the timeline to jump to that point
- Time display — Shows elapsed time and total session duration
- Exit — Click the X to leave replay mode
During replay, the graph updates to show the session's state at each point in time:
- Stage status — Stages change from pending to active to completed as the replay progresses
- Assignee avatars — Show who was assigned at each stage
- Data entry flashes — Brief highlights appear on stages when participants entered data
The side panel shows the event log — a chronological list of everything that happened during the session, including stage activations, assignments, completions, and data entries. Click any event in the log to jump to that moment.
See also: Learn about designing workflows in Workflows, or see the participant experience in Sessions.